

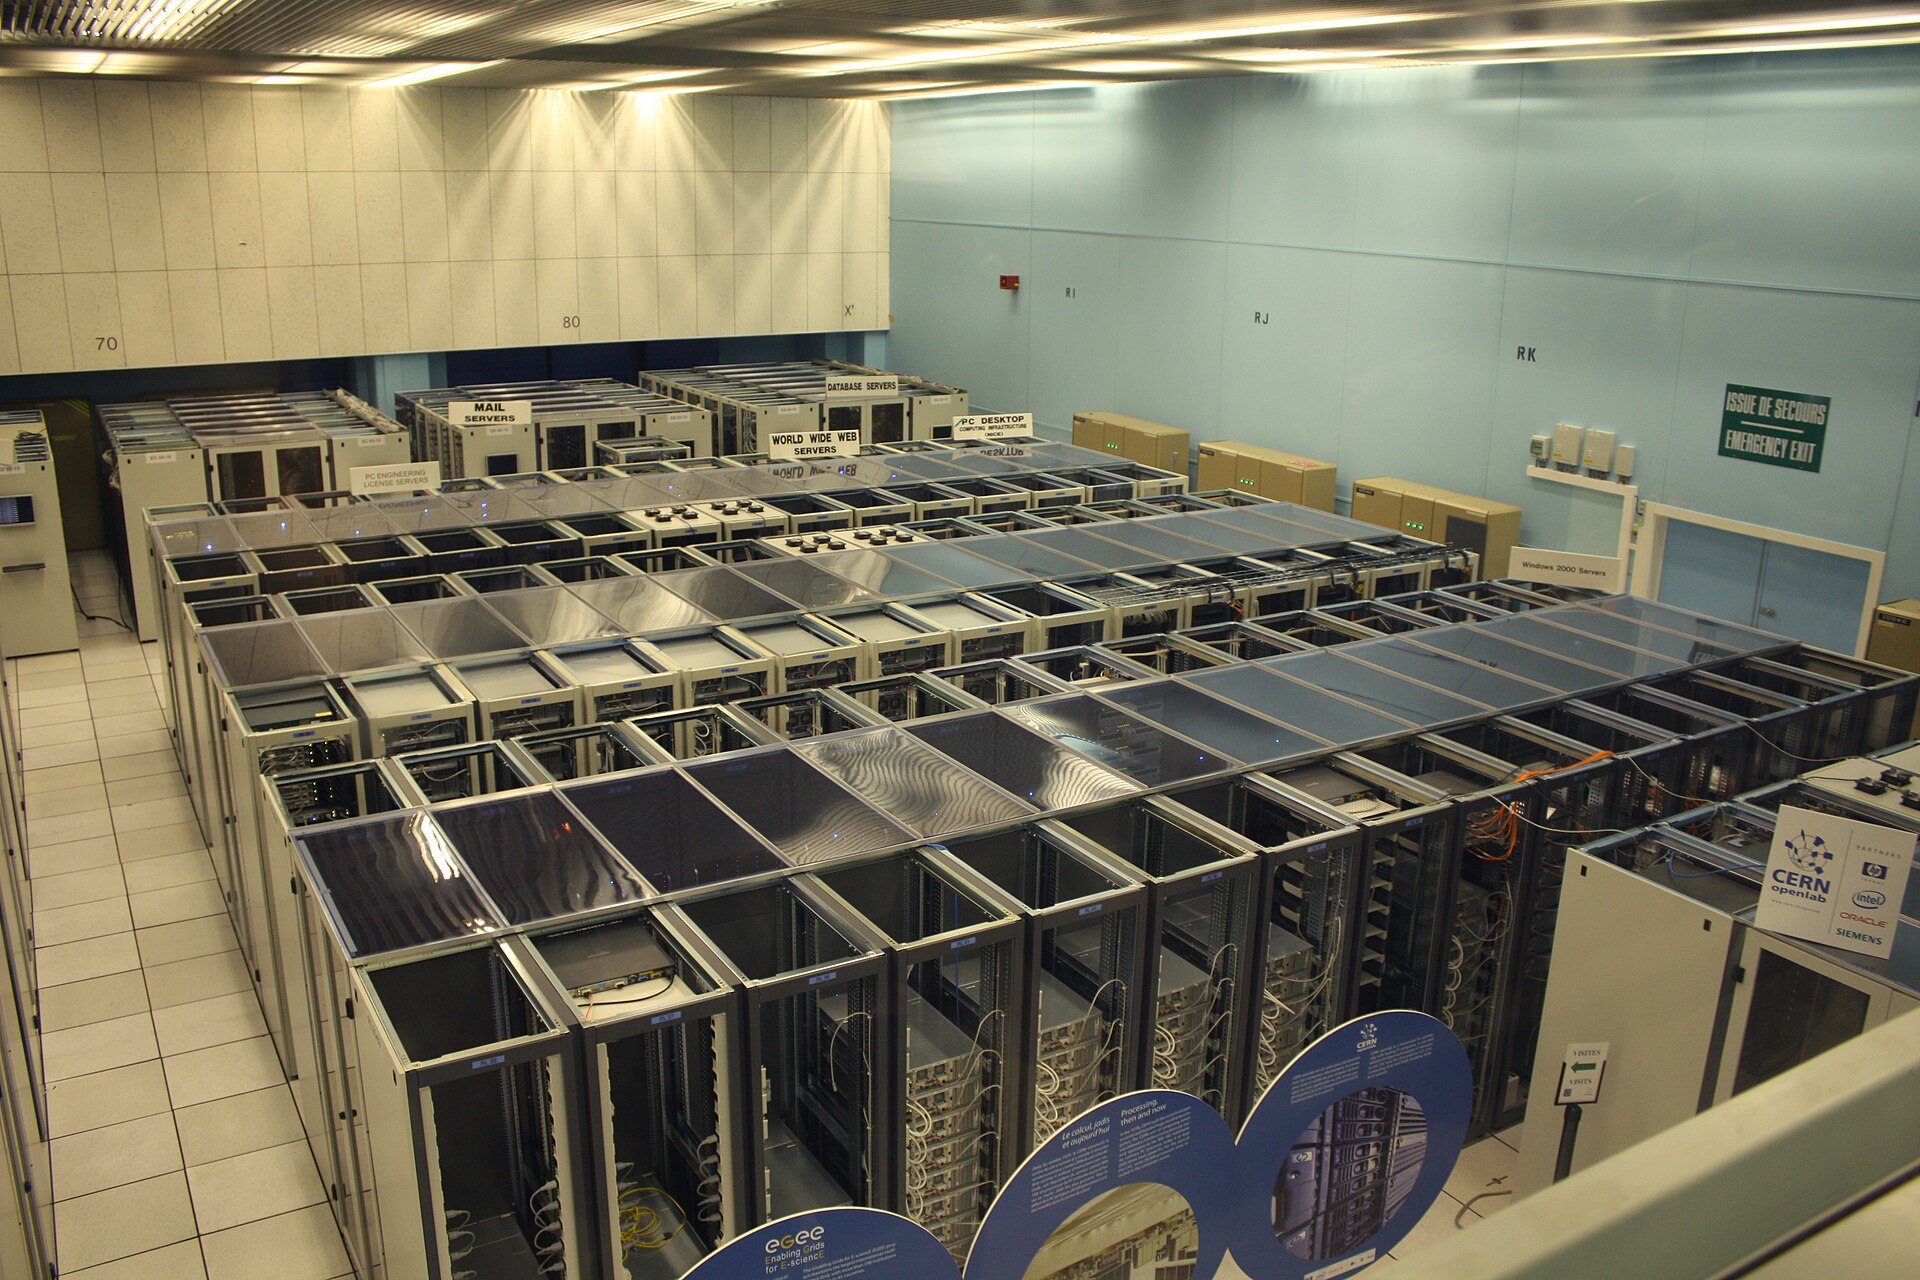
Photos via Wikimedia Commons: Hugovanmeijeren, CC BY-SA · Eric Kounce, public domain · Spencer Musick, CC BY-SA
HOME / POWER
NexGen Power Solution
Behind-the-meter Power without waiting for the grid.
On-site Power that sits on your side of the utility meter, in containerized NexGen modules of up to 5 MW: a gas turbine plus an organic Rankine cycle (ORC) that turns its exhaust heat into more Power, from the same fuel.
GAS TURBINE
3.3 MWe
- Pipeline gas or LNG
- Fits a 12–24 month site build
ORGANIC RANKINE CYCLE
up to 1.7 MWe
- Recovers turbine exhaust heat
- Air-cooled: zero water or steam
NEXGEN MODULE
up to 5 MW
- ~50% more Power per turbine
- ~34% less fuel, CO₂ and NOx per MWh
Market gap
Data centers are outrunning the grid.
Demand is real, the grid is slow, and on-site Power is moving to modular systems like NexGen’s.
The demand
- US data centers used 176 TWh in 2025. By 2030 that could reach 420–728 TWh.
- Data centers drive about 40% of US electricity demand growth.
- They need about 12 GW of new capacity a year. The grid’s best year ever added 10 GW.
The response
- About 40% of new data center capacity is now planned to be powered on site, up from almost none in 2025.
- That shift adds about 1.3 Bcf/d of natural gas demand by 2030.
- The bottleneck is time: grid hookups, transformers and big gas plants all take years.
The time-to-Power gapTypical lead times, months
DATA CENTER BUILD 12–24 MO
NexGen modular system
MV switchgear
Power transformer
Grid interconnection
Combined-cycle gas plant
024487296
Sources: RaboResearch; Enverus Intelligence Research; BNEF; LBNL queue data; S&P Global; McKinsey via Jefferies; Goldman Sachs; Foley; JLL. NexGen delivery: 12 months (NexGen estimate).
Opportunity
23–39 GW of new on-site Power.
US and Canada, 2026–2030: new generation where a 5 MW containerized block fits.
- 23–39 GW of new on-site generation in the US and Canada from 2026 to 2030, in applications where a 5 MW block fits.
- That is roughly 4,600–7,800 NexGen-sized modules, or about 1,000–1,500 a year.
- A 100 MW data center campus needs about 22 modules to back it up.
20272028202920302031
Sources: Enverus; S&P Global; McKinsey via Jefferies; Argus (AESO); PJM; ERCOT; NERC. Phase timing is NexGen judgment. Module-equivalents are a sizing aid, not a NexGen share forecast; the market is shared by all modular technologies.
5MW Power Module technology
More Power from every turbine.
Take the guided tour, or switch to Full system and tap any component.
NexGen Containerized Power Solution (up to 5MW)
Darker shades = high pressure · lighter shades = low pressure

Tap any component in the diagram for details.
Highlight
Gas turbine
3.3 MWe
Direct-coupled generator
ORC generator
1.4–1.7 MWe
Gross; 1.51 MWe at design point
ORC auxiliaries
−0.19 MW
Feed pump, fans, hot oil pump
Plant net output
≈ 4.6 MWe
Gas turbine + ORC net
ORC values are from the design-point process model and are shown for illustration. High/low pressure refers to the two closed loops: thermal oil and ORC working fluid.
What’s in the module
- A 3.3 MWe gas turbine-generator that runs on pipeline gas or LNG.
- An organic Rankine cycle making up to 1.7 MWe more from the turbine’s exhaust heat.
- About 4.6 MWe net at the design point, after the module’s own pumps and fans.
- Air-cooled, so no water or steam, in ISO-container footprints.
What the ORC adds
- Up to 50% more Power from every turbine.
- About a third less fuel, CO₂ and NOx for each MWh.
- More megawatts at a time when turbines are hard to get.
Design basis per NexGen process flow diagram: 3.3 MWe gas turbine at ~12,000 Btu/kWh plus up to 1.7 MWe ORC.
Why NexGen
NexGen modules win the on-site buildout.
Click a row to compare the on-site options at the 5 MW scale.
What “modular” means at NexGenOne standard 5 MW building block, repeated to fit any site.
ContainerizedFactory-built in ISO-container footprints and shipped by truck.
ScalableAdd 5 MW blocks as load grows: ~22 modules Power a 100 MW campus.
RedundantMany small units: ~1.1× overbuild for N+1 vs. ~1.5× for large frames.
FastNexGen can deliver in 12 months, inside a data center build.
| OPTION | UNIT SIZE | LEAD TIME | EFFICIENCY |
|---|
- NexGen can deliver in 12 months. A combined-cycle plant takes 80 months or more.
- Many small units back each other up, so a site needs about 1.1× overbuild instead of 1.5× with large frames.
- About 70% of planned gas builds are expected to go to faster modular systems.
Sources: Enverus, ‘Build More, Wait Less’ (Aug 2026); RaboResearch; Goldman Sachs (Sept 2026); NexGen design basis; NexGen delivery estimate. “—” = not quantified in the sources used.
Fuel economics
The ORC pays most where fuel is expensive.
Fuel cost per MWh
SAVED PER MWh
FUEL SAVED PER MODULE / YR
3.3 MW turbine only
NexGen 5 MW module
Fuel only. Heat rates 12.0 vs. 7.92 MMBtu/MWh (design basis); yearly figure at 5 MW for 8,000 hours vs. generating the same energy with turbines alone. Excludes O&M and financing.
Applications
Where the module fits first.
Click an application for details.
Pilot to production
From first module to fleet output.
Power launch Oct-28
Gold stages are underway. Engineering to launch: 2 yrs 6 mos. Dates after launch are planning targets.